


In Evidence

Other stars in Cassiopeia
- Schedar
- Caph
- γ Cassiopeiae
- Ruchbah
- Segin
- Achird
- Fulu
- 50 Cassiopeiae
- κ Cassiopeiae
- θ Cassiopeiae
- ι Cassiopeiae
- 48 Cassiopeiae
- ο Cassiopeiae
- ρ Cassiopeiae
- Castula
- χ Cassiopeiae
- λ Cassiopeiae
- ψ Cassiopeiae
- HR9066
- ξ Cassiopeiae
- HR244
- υ1 Cassiopeiae
- 1 Cassiopeiae
- HR932
- τ Cassiopeiae
- σ Cassiopeiae
- ν Cassiopeiae
- HR8926
- π Cassiopeiae
- 4 Cassiopeiae
- φ Cassiopeiae
- ω Cassiopeiae
- HR8752
- HR144
- HR743
- μ Cassiopeiae
- 42 Cassiopeiae
- 49 Cassiopeiae
- HR567
- 40 Cassiopeiae
- 31 Cassiopeiae
- 47 Cassiopeiae
- HR233
- 12 Cassiopeiae
- 23 Cassiopeiae
- HR196
- HR164
- 6 Cassiopeiae
- HR9010
- HR8853
- HR266
- HR342
- HR9059
- HR8832
- HR8894
- HR461
- HR91
- 32 Cassiopeiae
- 53 Cassiopeiae
- HR860
- 10 Cassiopeiae
- 43 Cassiopeiae
- HR124
- HR511
- 21 Cassiopeiae
- HR189
- HR439
- 2 Cassiopeiae
- HR60
- HR96
- HR747
- 44 Cassiopeiae
- HR326
- HR146
- HR9110
- HR829
- 38 Cassiopeiae
- HR177
- HR297
- HR212
- 9 Cassiopeiae
- HR922
- HR62
- HR292
- HR135
- HR113
- HR791
- HR5
- HR273
- HR298
- HR9052
- 52 Cassiopeiae
- HR561
- HR237
- 55 Cassiopeiae
- HR428
- HR65
- HR181
- HR815
- 13 Cassiopeiae
- HR8761
- HR112
- HR260
- HR241
- HR499
- HR579
- HR8985
- HR861
- HR9097
- HR502
- HR8981
- HR250
- HR1080
- HR256
- HR626
- HR375
- HR1032
- HR9020
- HR200
- HR9019
- HR488
- 35 Cassiopeiae
- HR482
- HR261
- HR381
- HR318
- HR8886
- HR278
- HR207
- HR238
- HR8990
- HR8803
- HR9017
- HR354
- HR129
- HR316
- HR8778
- HR9028
- HR8881
- HR391
- HR839
- HR9063
- HR287
- 16 Cassiopeiae
- HR398
- HR8770
- HR9000
- HR76
- HR204
- HR598
- HR8854
- HR309
- HR302
- HR8989
- HR1055
- HR449
- HR668
- HR481
- HR28
- HR365
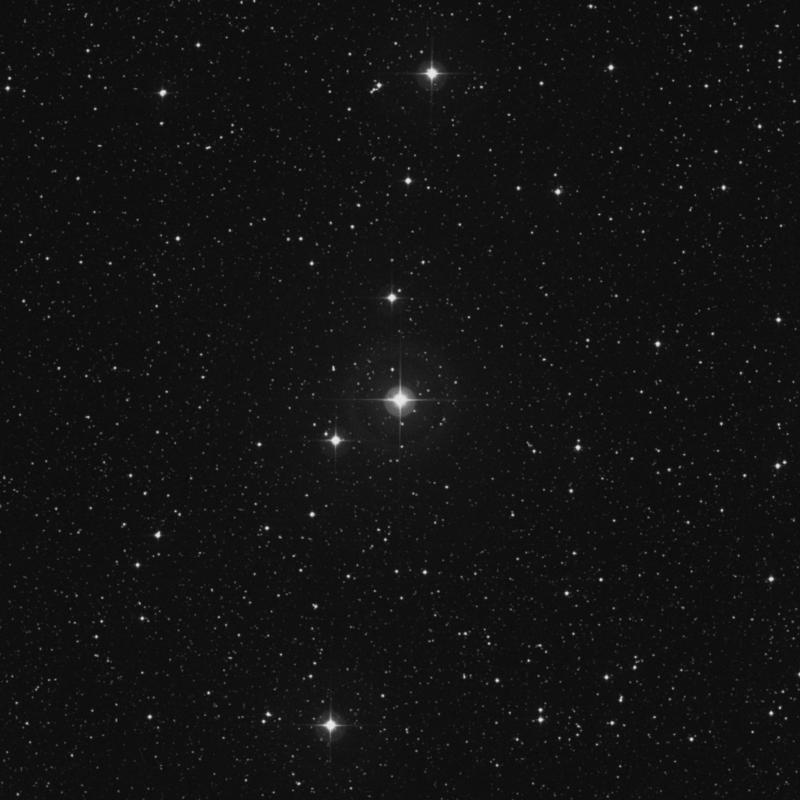
55 Cassiopeiae
55 Cassiopeiae is a variable hypergiant star of spectral class G0 in the constellation of Cassiopeia.
55 Cassiopeiae visual magnitude is 6.07. Because of its faintness, 55 Cassiopeiae is visible to the naked eye only from locations with very dark skies, while it is not visible at all from skies affected by light pollution.
Celestial Coordinates
Apparent
J2000
Galactic Coordinates
Finder Chart

Magnitude, Color, Spectral Class
The red dot in the diagram below shows where 55 Cassiopeiae is situated in the Hertzsprung–Russell diagram.
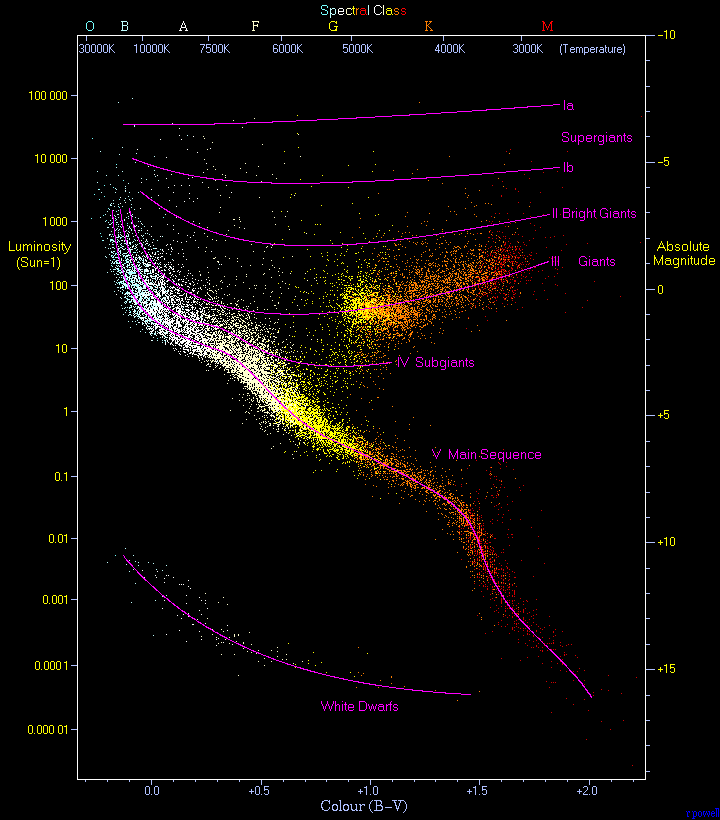
Distance, Radial Speed, Proper Motion
55 Cassiopeiae is distant 737.56 light years from the Sun and it is moving towards the Sun at the speed of 12 kilometers per second.
Alternative Designations
Visibility from Your Location
Today's 55 Cassiopeiae rise, transit and set times from Sabang Indan, Philippines are the following (all times relative to the local timezone Asia/Manila):